NFL Week 17 Playoff Picture: 10,000 Simulations Reveal Super Bowl LIX Favorites

As the 2024-25 NFL regular season enters its final stretch, the playoff race intensifies. Based on the latest NFL standings as of December 31, 2024, we’ve analyzed the playoff picture for both the AFC and NFC. By factoring in win-loss records, division standings, and tiebreaker rules, we’ve simulated the playoffs 10,000 times to project each team’s chances of advancing and, ultimately, winning the Super Bowl. Read on for the complete breakdown and key insights from these simulations.
AFC Playoff Picture
Here is how the AFC playoff seeding would look if the NFL playoffs began today:
Division Winners (Seeds 1–4)
-
Kansas City Chiefs (15-1) - Best record in the AFC.
-
Buffalo Bills (13-3) - Second-best record in the AFC.
-
Baltimore Ravens (11-5) - AFC North champions.
-
Houston Texans (9-7) - AFC South champions.
Wild Cards (Seeds 5–7)
-
Los Angeles Chargers (10-6) - Best wild card record.
-
Pittsburgh Steelers (10-6) - Tied with the Chargers but seeded lower due to point differential and head-to-head tiebreakers.
-
Denver Broncos (9-7) - Final wild card spot as the next best record.
First-Round Matchups
-
(1) Kansas City Chiefs: Bye
-
(2) Buffalo Bills vs. (7) Denver Broncos
-
(3) Baltimore Ravens vs. (6) Pittsburgh Steelers
-
(4) Houston Texans vs. (5) Los Angeles Chargers
NFC Playoff Picture
Here is how the NFC playoff seeding would look if the NFL playoffs began today:
Division Winners (Seeds 1–4)
-
Detroit Lions (14-2) - Best record in the NFC.
-
Philadelphia Eagles (13-3) - NFC East champions.
-
Los Angeles Rams (10-6) - NFC West champions.
-
Tampa Bay Buccaneers (9-7) - NFC South champions.
Wild Cards (Seeds 5–7)
-
Minnesota Vikings (14-2) - Best wild card record.
-
Washington Commanders (11-5) - Second wild card.
-
Green Bay Packers (11-5) - Final wild card spot.
First-Round Matchups
-
(1) Detroit Lions: Bye
-
(2) Philadelphia Eagles vs. (7) Green Bay Packers
-
(3) Los Angeles Rams vs. (6) Washington Commanders
-
(4) Tampa Bay Buccaneers vs. (5) Minnesota Vikings
Breaking Down the Playoff Chances: Which Teams Have the Best Shot at Super Bowl Glory?
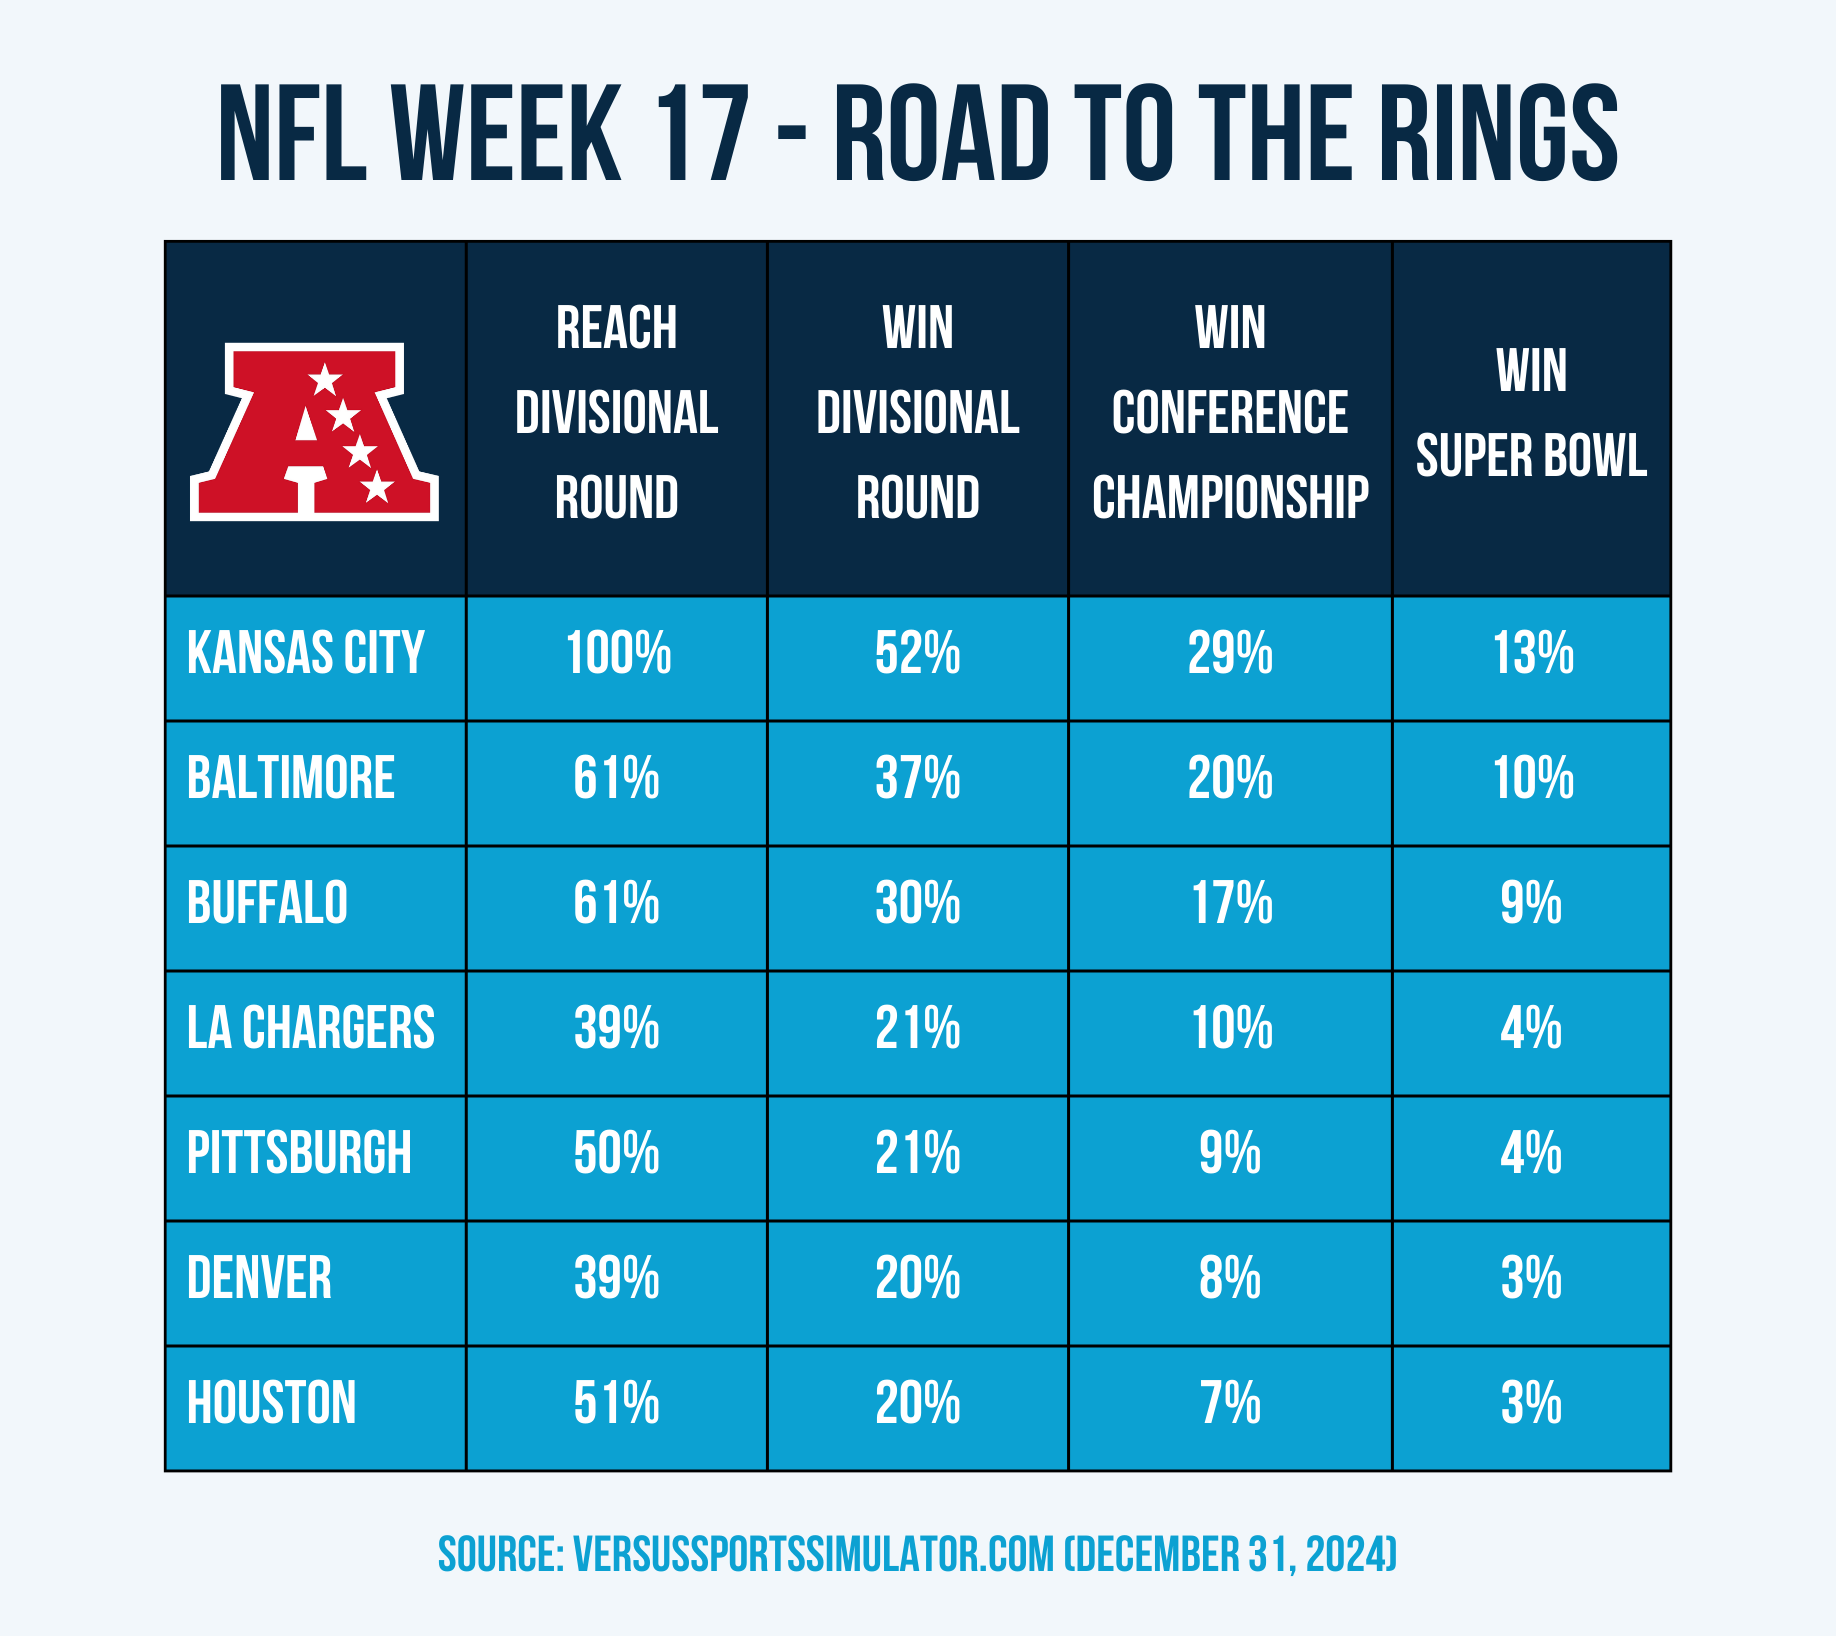
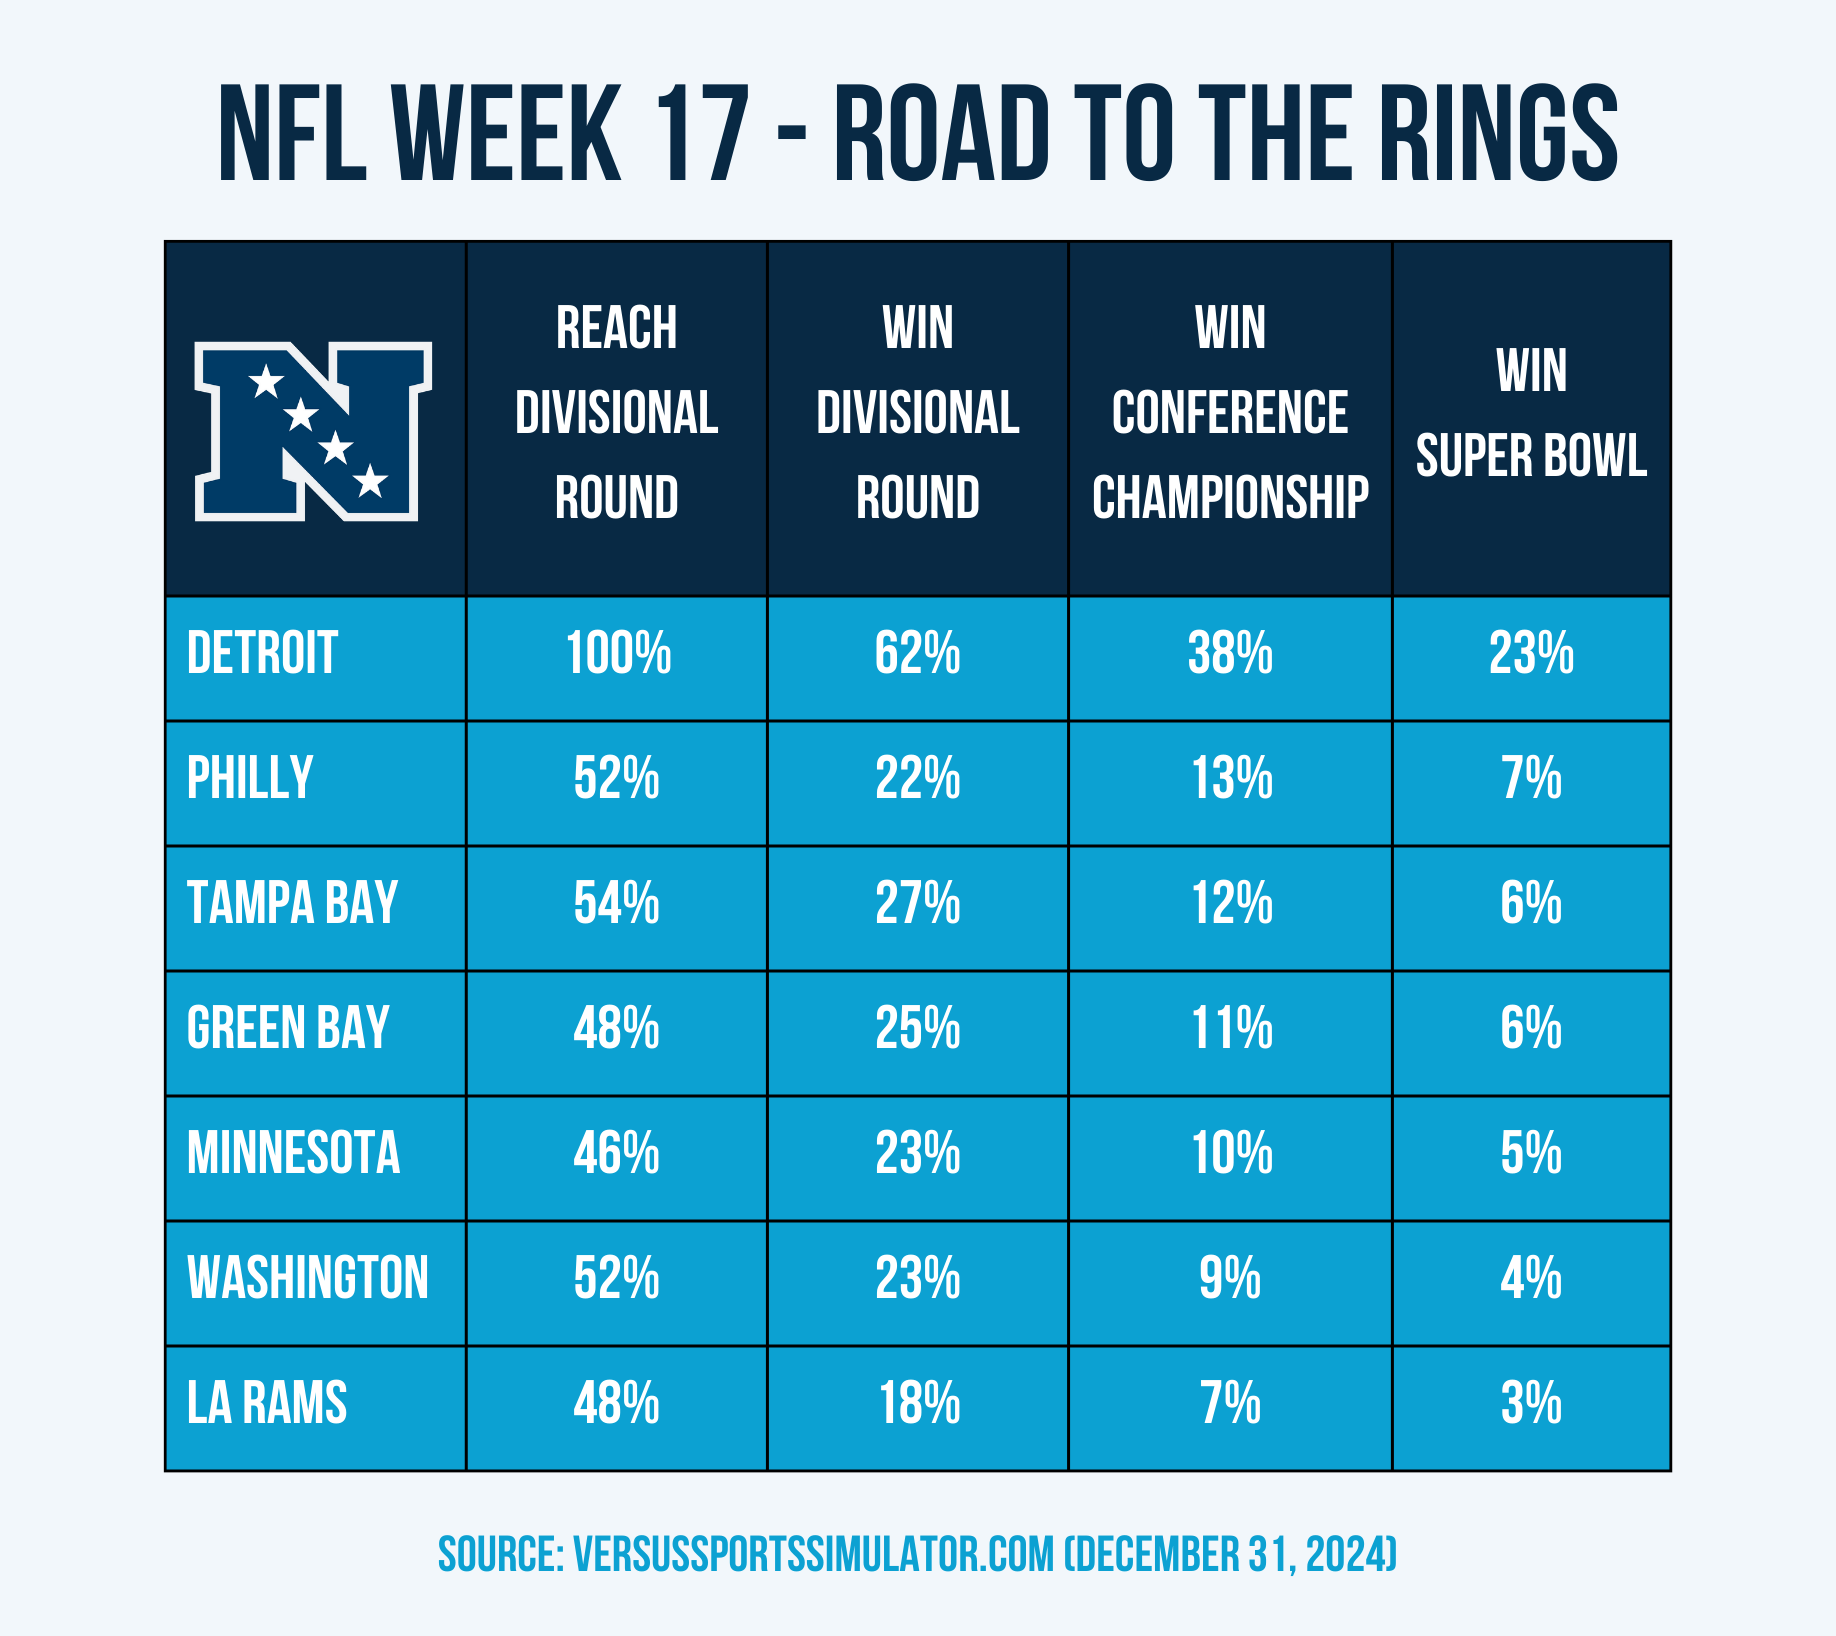
Versus Sports Simulator simulated the NFL Playoffs 10,000 times to determine the most likely winner. The results of the simulations highlight some compelling playoff scenarios and Super Bowl probabilities. In the NFC, the Detroit Lions lead the way with a 23% chance of winning the Super Bowl, followed by the Green Bay Packers and Tampa Bay Buccaneers, each at 6%. The AFC picture is similarly competitive, with the Kansas City Chiefs holding a 13% chance of claiming the title, while the Baltimore Ravens and Buffalo Bills trail closely at 10% and 9%, respectively. Other contenders, such as the Philadelphia Eagles (7%), Minnesota Vikings (5%), and Los Angeles Chargers (4%), remain in the mix. With so many teams retaining a path to Super Bowl glory, the playoffs promise to be unpredictable and thrilling.
Simulation Results Breakdown: AFC & NFC Playoff Chances
The simulations reveal some interesting playoff scenarios. In the NFC, the Detroit Lions hold a 23% chance of winning the Super Bowl, while the Kansas City Chiefs lead the AFC with a 13% chance. These probabilities reflect the teams' current positions and their projected performance throughout the playoffs.


Combined NFL Playoff Simulation Results
| Division | Team | % Reached Divisional | % Reached Conference Championship | % Reached Super Bowl | % Won Super Bowl |
|---|---|---|---|---|---|
| NFC North | Detroit | 100% | 62% | 38% | 23% |
| AFC West | Kansas City | 100% | 52% | 29% | 13% |
| AFC North | Baltimore | 61% | 37% | 20% | 10% |
| AFC East | Buffalo | 61% | 30% | 17% | 9% |
| NFC East | Philadelphia | 52% | 22% | 13% | 7% |
| NFC South | Tampa Bay | 54% | 27% | 12% | 6% |
| NFC North | Green Bay | 48% | 25% | 11% | 6% |
| NFC North | Minnesota | 46% | 23% | 10% | 5% |
| AFC West | LA Chargers | 39% | 21% | 10% | 4% |
| AFC North | Pittsburgh | 50% | 21% | 9% | 4% |
| NFC East | Washington | 52% | 23% | 9% | 4% |
| AFC West | Denver | 39% | 20% | 8% | 3% |
| NFC West | LA Rams | 48% | 18% | 7% | 3% |
| AFC South | Houston | 51% | 20% | 7% | 3% |
Conclusion
As the playoffs draw near, the chances of these teams advancing will evolve. Stay tuned as we continue to simulate and track the road to the Super Bowl!
Please note that some links in this article may be sponsored or contain affiliate content.
